Calibrated light curve and phase diagram
In this example, we query the APPLAUSE DR3 database for a light curve of the Algol-type eclipsing binary V466 Cyg. The star has a known period of 1.39156629 days and is located in the region of the sky that is covered by a large number of plates (702).
From Simbad we get the Tycho-2 designation: TYC 2673-2051-1.
The easiest way to retrieve the light curve is to use the example query "DR3 light curve by star ID" link in the query interface. Let's enter the Tycho-2 designation into the example query:
SELECT year_mid,bmag FROM applause_dr3.lightcurve
WHERE tycho2_id='2673-2051-1' AND year_mid IS NOT NULL
ORDER BY year_mid
The resulting table has 701 rows. Under the plot tab, we can visualize the light curve, and save the plot:
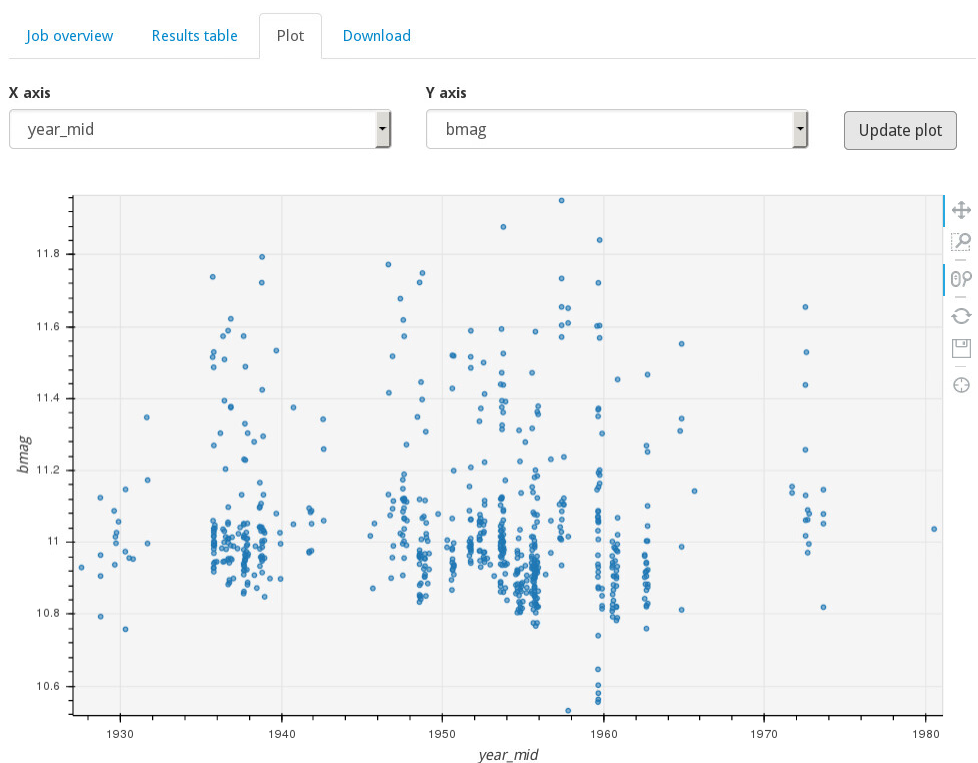
One thing to keep in mind is that there are plates in the APPLAUSE database that do not have observation start and end times from lack of logbook data for observing time, e.g. year_mid value. These timestamps are not suitable for studying short-period eclipsing binaries. We excluded rows with missing observation times by specifying year_mid IS NOT NULL in the query.
V466 Cyg has a known orbital period of 1.39156629 days. We can use this to fold the obtained light curve and plot a phase diagram. We calculate phase by using the SQL function FLOOR(number) that returns the integer part of a real number. The expression for the V466 Cyg phase is (jd_mid - FLOOR(jd_mid/1.39156629)*1.39156629)/1.39156629 AS phase.
We also exclude some outliers from the table (see above plot around 1960) by using the interval 10.5 ≤ bmag ≤ 12.25, just for demonstration purpose.
The whole query then reads:
SELECT (jd_mid - FLOOR(jd_mid/1.39156629)*1.39156629)/1.39156629 as phase, bmag
FROM applause_dr3.lightcurve
WHERE tycho2_id = '2673-2051-1'
AND (bmag BETWEEN 10.5 AND 12.25)
ORDER BY jd_mid
Using the plot feature, we obtain the phase diagram:
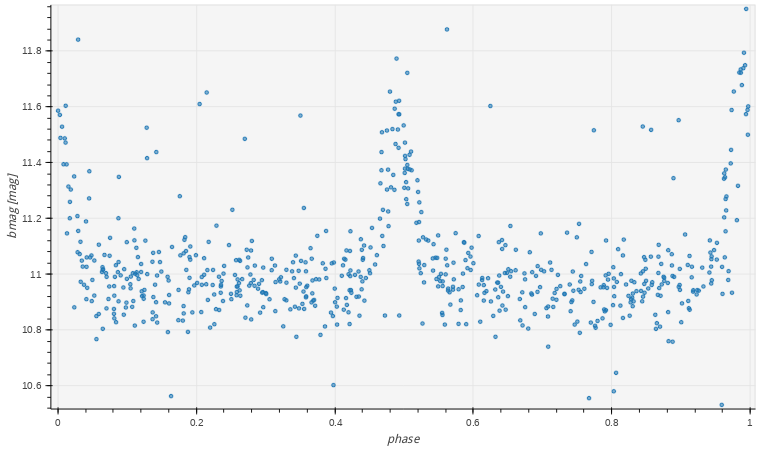
Please note that the magnitude axis cannot be reversed in the plot interface and eclipses are upwards.