Air temperature vs time
Observation logbooks often contain data on sky and weather conditions. In Potsdam, these data have been transcribed and stored in the APPLAUSE database. In this example, we show how to retrieve Potsdam-Telegrafenberg air temperature associated with plates and how to visualize it with a plot.
Air temperature is stored in the air_temperature column in the plate table. Observation time is stored in multiple columns in the exposure table. Here we use the year_start column that gives decimal year of the start of exposure.
To get time and temperature together in a result table, we need to query both the plate and exposure tables using plate_id identifier, DISTINCT for having only once the plate_id retrieved. Additionally we select ut_start for easy interpreting the time, and year_start for plotting the time. Further, we select only plates that have non-empty temperature values, air_temperature IS NOT NULL, and have been obtained at Potsdam site, site_name='%Potsdam%'. The full SQL query is the following:
SELECT DISTINCT e.plate_id, e.ut_start, e.year_start, p.air_temperature, p.site_name
FROM applause_dr3.plate as p,
applause_dr3.exposure as e
WHERE p.plate_id = e.plate_id
AND  p.air_temperature IS NOT NULL
AND e.year_start IS NOT NULL
AND p.site_name like '%Potsdam%';
The resulting table has 2309 rows in DR1, 2528 in DR2, 2583 in DR3. You can get the DR(1|2) numbers by changing applause_dr3 to applause_dr(1|2).
If you only want the temperature at Potsdam-Telegrafenberg, use site_name='Potsdam-Telegrafenberg'
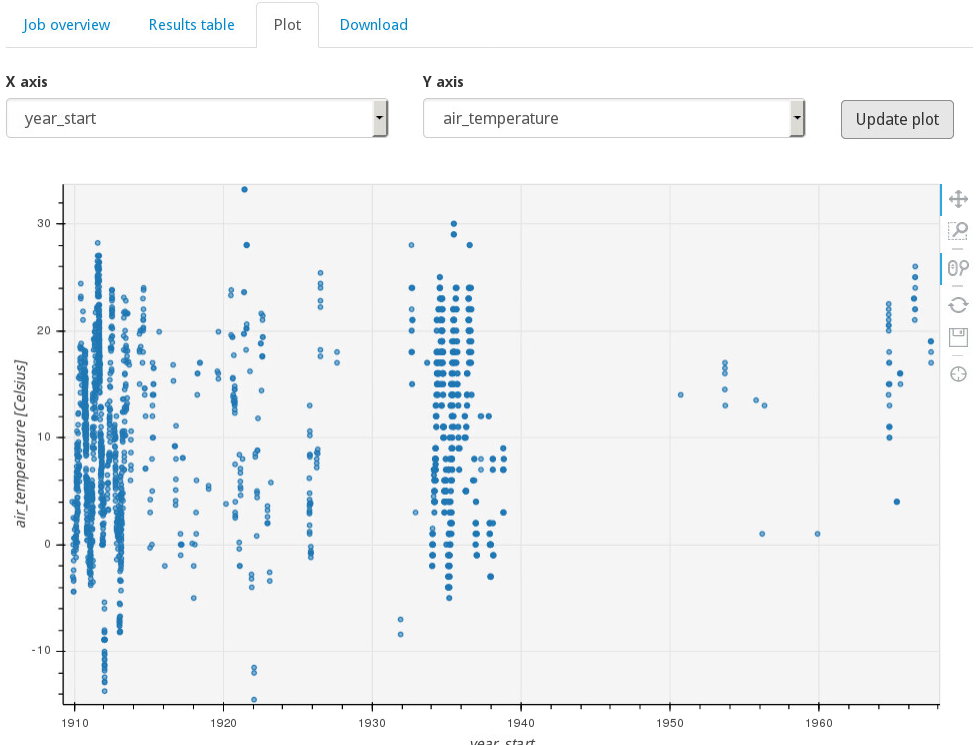
We can plot the temperature at Potsdam-Telegrafenberg values versus time from DR3 in the Plot tab:
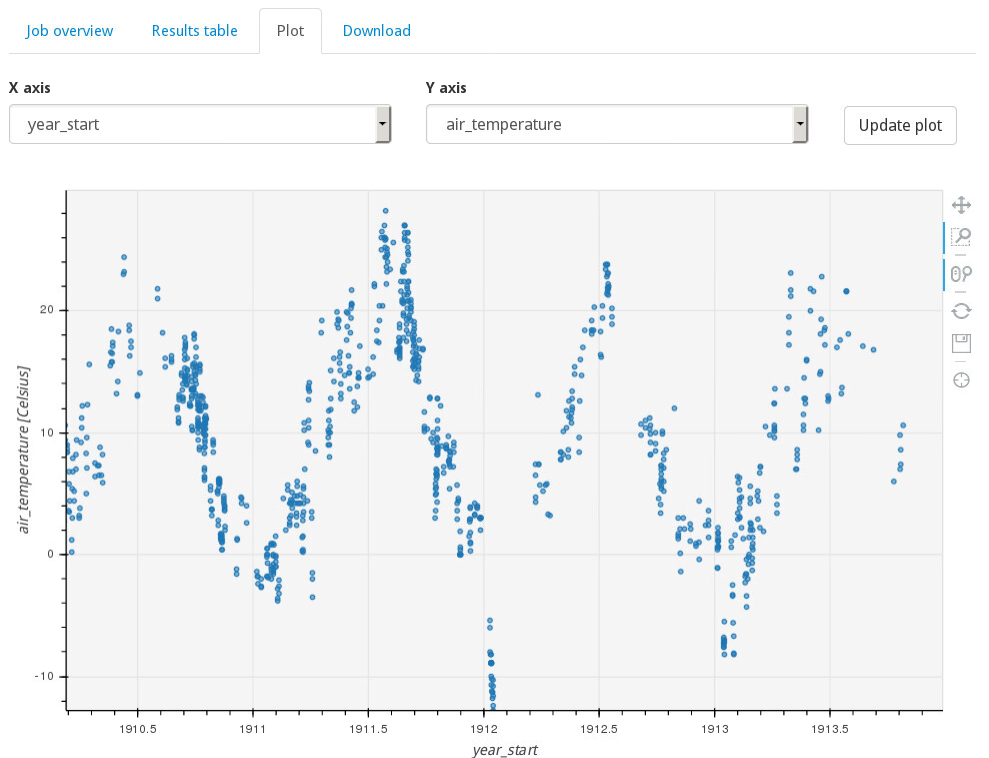
By using the box-Plot selector for the range from 1910 to 1914, we get the following temperature curve, showing annual variations: